
This report provides a pivot grid of company-wide emissions by gases over a given time period.
By default, the report shows:
- Carbon dioxide
- Methane
- Nitrous Oxide
- HFCs
- PFCs
- SF6
- Other
- tCO2e (tonnes of CO2 equivalent)
These gases are defined by the gas breakdown used when creating an emission factor.
Every in-scope Inventory has to have an associated Emission Factor, and each Emission Factor requires a gas breakdown for this table to show the correct information.
Filters and sorting can be applied to show gas emissions by:
- Different categories, groups and classifications
- Across time periods - calendar year, quarters etc
- Particular gas types
- By different UoM (units of measure)
- Use this guide to using common pivot grid functionality to help refine the report
To find this feature, on the menu bar, select Reports > Reports > Group-wide emissions by gases.

Quick Guide
To get started:
- Choose the period of time to display
We recommend selecting your reporting year, i.e., 12 Months to the end of March 2021 - Select any other options required
- Click Remember my layout to keep the options chosen for next time
- Select Run report...

- Once the Report is run, a pivot grid as shown below will appear:

Refine the Report
To maximise the effectiveness of this report, we recommend the following steps:
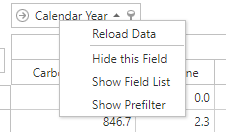
- Right click on the year as shown below and select Hide this Field.
If the period in the bar is the same period as the one the report was run for, leave as is and skip the next step.
- In the top bar, search for the relevant reporting period and drag it to the location where the original date field was.
(Skip this step if the period in the bar is the same period as the one the report was run for.)
- FY March End for any period ending in March.
- FY Sept End for any period ending in September.
- Calendar Year for any period ending in December.
- FY June End for any period ending in June.
- If your reporting period does not exist in this top menu, leave it blank.

- The report headers should now appear as below:

- If required, change the report groupings:
- Remove them by right clicking on the heading name and selecting Hide this field.
This will remove the field from the table. - Add any of the following groupings by dragging them from the top menu and moving them into the rows section as a heading:
- Inventory Name.
- Classification 1, 2 or 3.
- UoM.
- Data Collection Sub-Group.
- Remove them by right clicking on the heading name and selecting Hide this field.
- Once this step is completed, rows should reflect the breakdown needed for your gases.
- Remove any gases by right clicking on a gas in the heading and selecting Hide this field. This removes the gas from the table.


- Add a gas to the table by selecting the Show other Gases list button and searching for the gas needed. Drag this gas into the above line.

Good to Know
- The order of line items can be changed by dragging the item and placing it in the order required, e.g., to move 'HC-600' to be the first gas on the table, drag the above line item to be in front of 'Carbon Dioxide'.

- The pivot grid can be exported to Excel by clicking on the Export to excel button after running the report and configuring it to requirements.
