
The pivot grid used in many reports, including on the data review pages, all have the same set of base functionalities including:
- Filter
- Sort
- Drill down
- Export
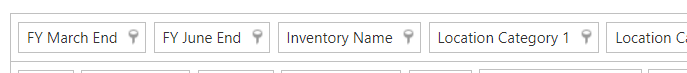
Available Fields
The top row of the pivot grid contains fields that are available but not currently being used. These can be dragged to the different areas of the grid as needed.
Conversely, any data being used can be dragged to this bar to remove it from use.
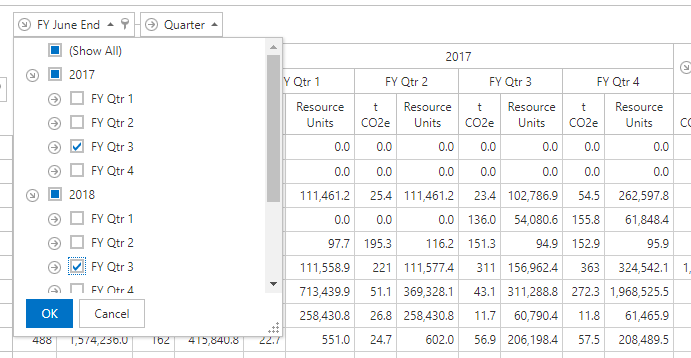
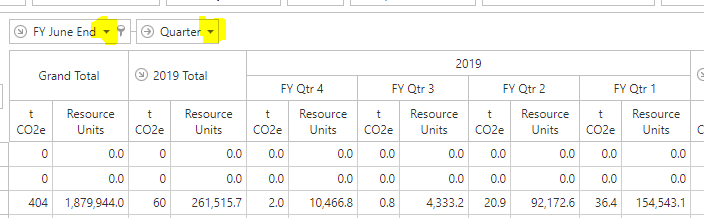
Filter
The filter icon provides different filtering options depending on the data type in question.
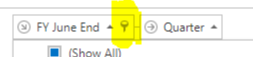
For example, to compare the third quarter of each financial year (ending June 30), click the filter button on the FY June End box, select the third quarter of each year and click "OK".
Sort
The sort icon provides sorting options depending on the data type in question.
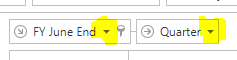
For example, in the picture below, the order of both the year and quarter have been reversed compared to the picture above.
Drill down
The drill down icon provides drill down options depending on the data type in question.
In the picture below, the Calendar Year drill down icon is pointing downwards. This is because there is a drill down into quarters and months. The line joining each field indicates that they are grouped in the drill down.

Export
In addition to a standard export, there is a "data aware" option.
Using this option mode optimises the export for subsequent analysis of pivot grid data within Microsoft Excel.
The first image below shows a "data aware" export with specific grouping available:
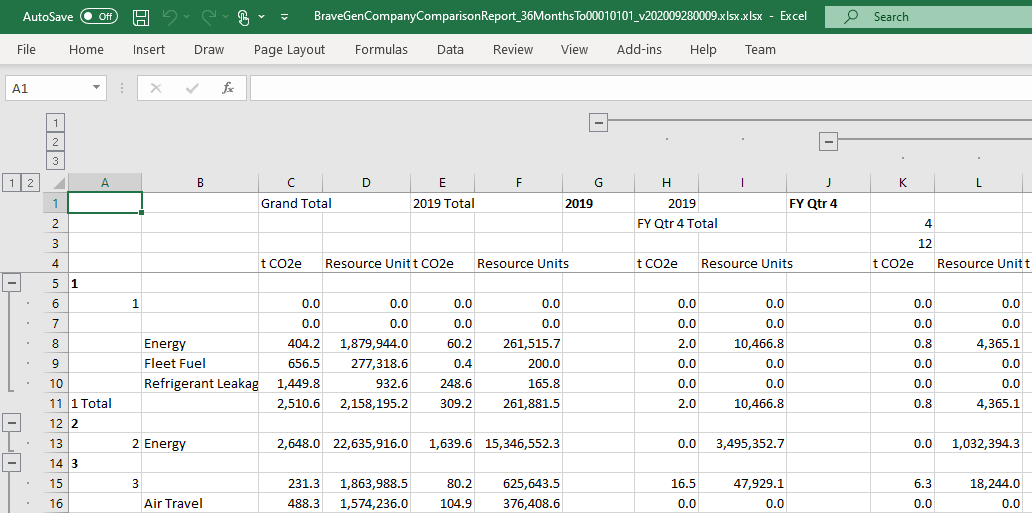
The second image shows a standard export:
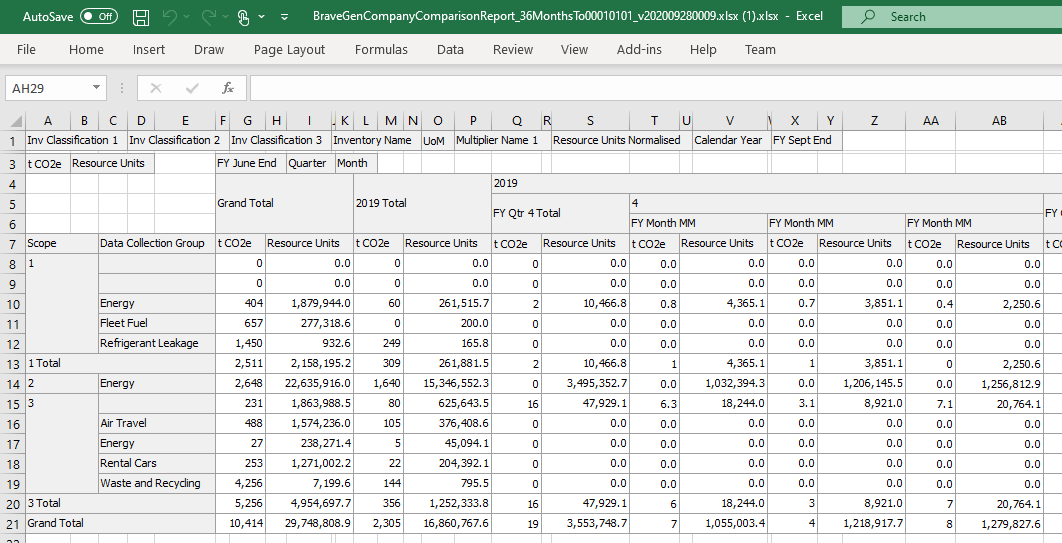
In both cases, the export still includes any sorting, filtering and drill downs chosen.