
This report provides a pivot grid of all emissions data over a given time period by subsidiary. This report can only be found in a group company, usually labelled with a group in its name.
By default, the report shows:
- tCO2e (tonnes of CO2 equivalent)
- Units (the activity data uploaded to the system).
This Report only shows data by Financial Year or Calendar Years and Quarters.
To find this feature, on the menu bar, select Reports > Reports > Group-wide emissions and resources.
Quick Guide
To get started:
- Choose the period of time to display.
We recommend selecting your reporting year, i.e., 12 Months to the end of March 2021. - Select any other options required
these will be remembered next time the report is run. - Select Run report...
Refining the Report
To maximise the effectiveness of this report, we recommend the following steps:
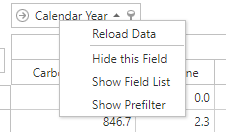
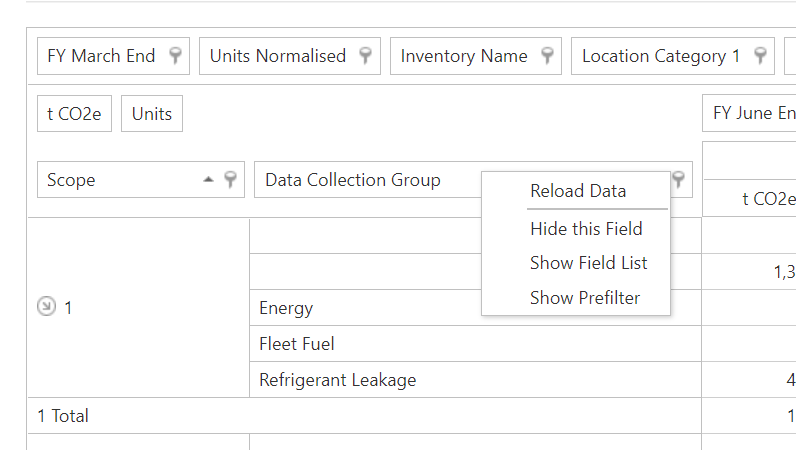
- Right click on the year as shown below and select Hide this Field.
If the period in the bar is the same period as the one the report was run for, leave as is and move the next step.
- In the top bar, search for the relevant reporting period and drag it to the location where the original date field was.
Skip this step if the period in the bar is the same period as the one the report was run for
- FY March End for any period ending in March
- FY Sept End for any period ending in September
- Calendar Year for any period ending in December
- FY June End for any period ending in June
If your reporting period does not exist in this top menu, leave it blank
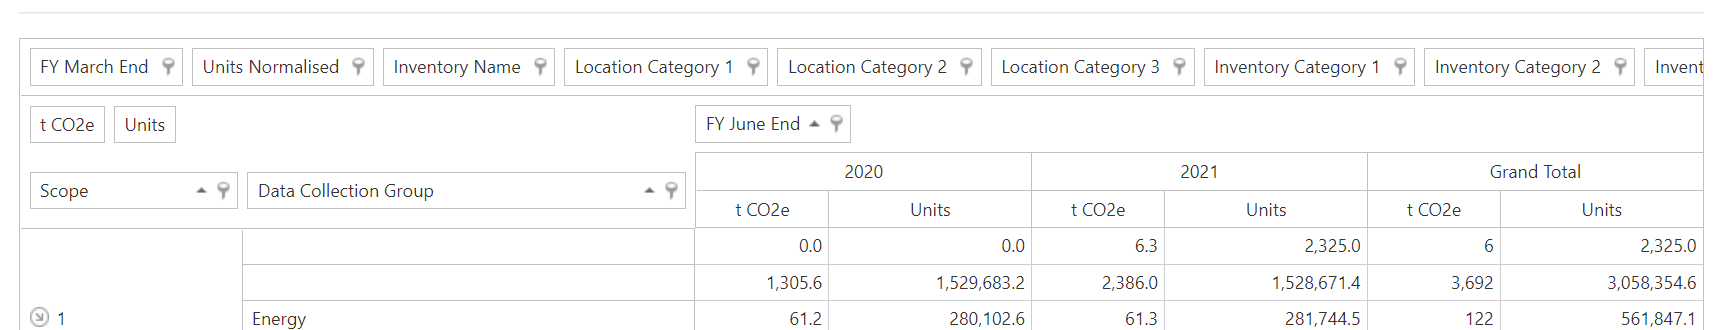
- The report headers should now appear as below
- If required, change the report groupings:
- Remove them by right clicking on the heading name and selecting Hide this field.
This will remove the field from the table
- Remove them by right clicking on the heading name and selecting Hide this field.
- Add any of the following groupings by dragging them from the top menu and moving them into the rows section as a heading:
- Inventory Name
- Location Category 1, 2 or 3
- Data Collection Sub-Group
- UoM
- Once this step is completed, rows should reflect the new breakdown
Good to Know
- The pivot grid can be exported to Excel by clicking on the Export to excel button after running the report and configuring it to requirements
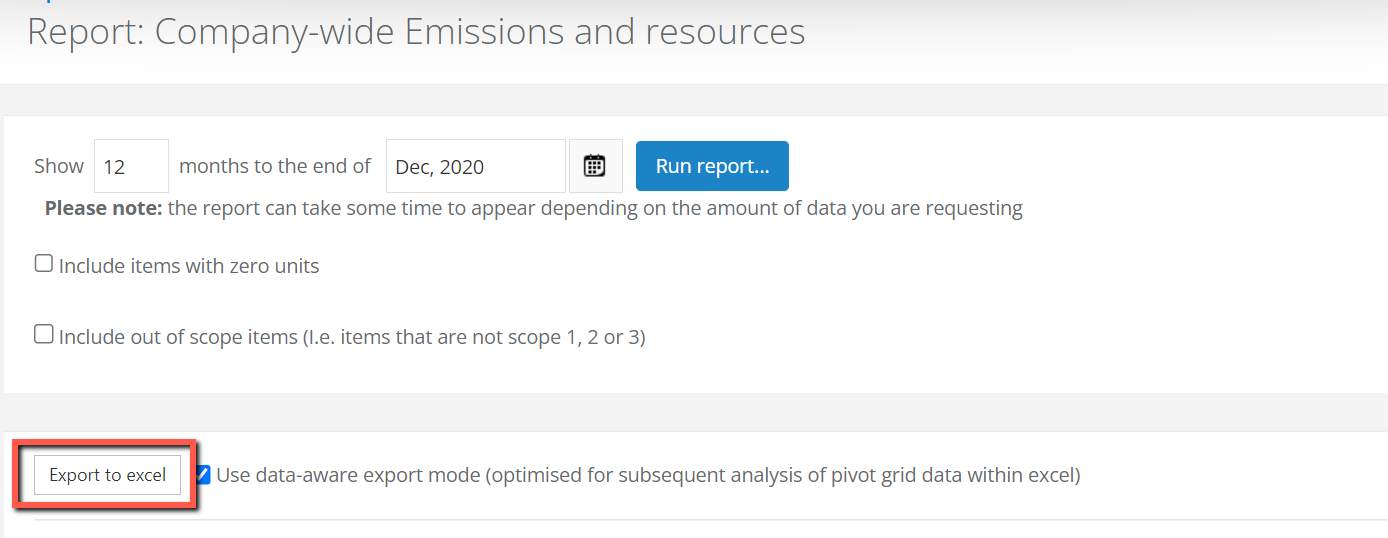
- It is best to leave the "Use data-aware export..." option unticked it you are after raw data
- For more information on refining and using this report, go to the guide to using common pivot grid functionality